How we count Forex trading with Bollinger Bands
You don’t find anyone who are not hear the name of Bollinger Bands .In Forex trading, Options Trading Strategies – Online Forex Trading – Stock Options Trading – Online Stock Trading as well as casino also in bond market Bollinger Bands are the common trading instrument. But Most of the people do not know what is that. They only use it by default. You have to know about Bollinger Bands if you want to make money fast.
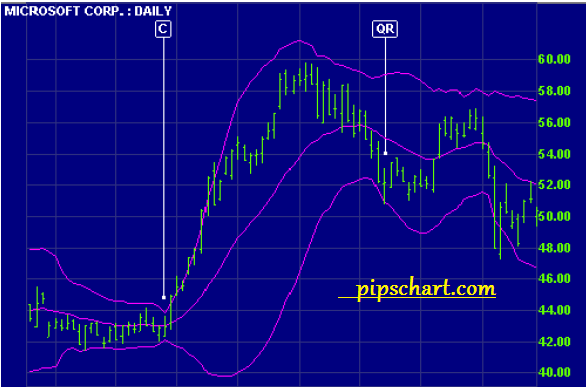
Bollinger Bands Developed by John Bollinger, Bollinger Bands allows users to compare volatility and relative price levels over a period time. Bollinger Bands are envelopes which surround the price bars on a chart. They are plotted two standard deviations away from a simple moving average. Because standard deviation is a measure of volatility, the bands adjust themselves to ongoing market conditions. They widen during volatile market periods and contract during less volatile periods.
Bollinger Bands are, essentially, moving standard deviation bands. Bollinger Bands are sometimes displayed with a third center line. This is the simple moving average line. Mr. Bollinger recommends using a 10 day moving average for short term trading, 20 days for intermediate term trading, and 50 days for longer term trading.
The standard deviation value may be varied. Increase the value of the standard deviation from 2 standard deviations to 2-1/2 standard deviations away from the moving average when using a 50 day moving average. Conversely, lower the value of the standard deviation from 2 to 1-1/2 standard deviations away from the moving average when using a 10 day moving average.
Bollinger Bands do not generate buy and sell signals alone. They should be used with another indicator. I use them with RSI, described below. This is because when price touches one of the bands, it could indicate one of two things. It could indicate a continuation of the trend; or it could indicate a reaction the other way. By themselves they do not tell us when to buy and sell.
However, when combined with an indicator such as RSI, they become powerful.RSI is an excellent indicator with respect to overbought and oversold conditions. When price touches the upper band, and RSI is below 70, we have an indication that the trend will continue. When price touches the lower band, and RSI is above 30, we have an indication that the trend will continue.
If we run into a situation where price touches the upper band and RSI is above 70 (possibly approaching 80) we have an indication that the trend may reverse itself and move downward. On the other hand, if price touches the lower band and RSI is below 30 (possibly approaching 20) we have an indication that the trend may reverse itself and move upward.
Avoid using several different indicators all using same input data. If you’re using RSI with the Bollinger Bands, don’t use MACD too. They both use the same inputs. Consider using On Balance Volume, or Money Flow with RSI. Relying on different inputs they measure different things. They can be used together as further confirmation of a trend.
While there are many ways to use Bollinger Bands, following are a few rules that serve as a good beginning point.
Few Rules :
1. Bollinger Bands provide a relative definition of high and low.
2. That relative definition can be used to compare price action and indicator action to arrive at rigorous buy and sell decisions.
3. Appropriate indicators can be derived from momentum, volume, sentiment, open interest, inter-market data, etc.
4. Volatility and trend have already been deployed in the construction of Bollinger Bands, so their use for confirmation of price action is not recommended.
5. The indicators used should not be directly related to one another. For example, you might use one momentum indicator and one volume indicator successfully.
6. Bollinger Bands can also be used to clarify pure price patterns such as “M” tops and “W” bottoms, momentum shifts, etc.
Another Vital Rules :
1. Price can, and does, walk up the upper Bollinger Band and down the lower Bollinger Band.
2.Closes outside the Bollinger Bands are continuation signals, not reversal signals. (This has been the basis for many successful volatility breakout systems.)
3.The default parameters of 20 periods for the moving average and standard deviation calculations, and two standard deviations for the bandwidth may be varied for the market.
4.The average deployed should not be the best one for crossovers. Rather, it should be descriptive of the intermediate-term trend.
5.If the average is lengthened the number of standard deviations needs to be increased simultaneously; from 2 at 20 periods, to 2.5 at 50 periods. If the average is shortened the number of standard deviations should be reduced; from 2 at 20 periods, to 1.5 at 10 periods.
6. Bollinger Bands are based upon a simple moving average. A simple moving average is used in the standard deviation calculation and we wish to be logically consistent.
7.Make no statistical assumptions based on the use of the standard deviation calculation in the construction of the bands. The sample size in most deployments of Bollinger Bands is simply too small for statistical significance.
8.Finally, tags of the bands are just that, tags not signals. Touching the upper band is NOT inand-of-itself a sell signal and touching the lower band is NOT in-and-of-itself a buy signal.
So much boring isn’t it.Just take a rest and think about it. Than go to below link for know deeply.


0 thoughts on “How we count Forex trading with Bollinger Bands”