Multiple Trend Line AFL: Awesome Amibroker Trading System AFL
MULTIPLE TREND LINE AFL FOR AMIBROKER
Multiple Trend Line AFL is one of the awesome amibroker trending system afl. It creates super trend indication with multiple trend line with Fibonacci that’s why it’s a best trending indicator forever. Yes, this Amibroker AFL makes your price chart with two lines. Long term trend line and short time trend line. As its creates auto lines so no need to draw a extra line. Also this AFL draw Fibonacci point under recent price action. This is the power of this AFL Amibroker.
In figure there is also use Bollinger bands. To use this trends support resistance also be shown in figure. AFL use three combination of amibroker afl code. Bollinger Bands, Multiple Trend and Fibonacci point. Using this amibroker indicators its a great powerful situation in amibroker chart for trading. Enjoy.
Image of AFL [amibroker formula language].
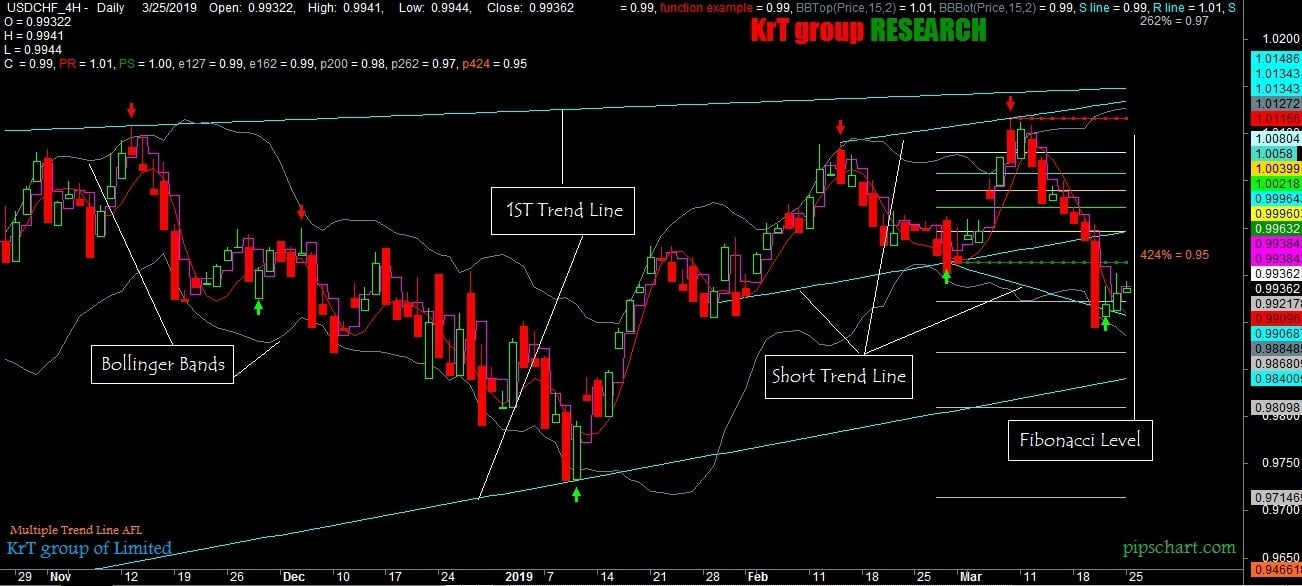
In image we find lot of amibroker buy sell signal. By amibroker trading system when Bollinger Bands and Trend line Mixed with breakout fail or breakdown fail than its a strong Buy Sell Signal. This AF clearly indicate by green & red arrow point. Also this super trend indicator use Fibonacci point which means that trader can easily realize which point the price retrace.
Multiple Trend Line for Amibroker AFL CODE
1 2 3 4 5 6 7 8 9 10 11 12 13 14 15 16 17 18 19 20 21 22 23 24 25 26 27 28 29 30 31 32 33 34 35 36 37 38 39 40 41 42 43 44 45 46 47 48 49 50 51 52 53 54 55 56 57 58 59 60 61 62 63 64 65 66 67 68 69 70 71 72 73 74 75 76 77 78 79 80 81 82 83 84 85 86 87 88 89 90 91 92 93 94 95 96 97 98 99 100 101 102 103 104 105 106 107 108 109 110 111 112 113 114 115 116 117 118 119 120 121 122 123 124 125 126 127 128 129 130 131 132 133 134 135 136 137 138 139 140 141 142 143 144 145 146 147 148 149 150 151 152 153 154 155 156 157 158 159 160 161 162 163 164 165 166 167 168 169 170 171 172 173 174 175 176 177 178 179 180 181 182 183 184 185 186 187 188 189 190 191 192 193 194 195 196 197 198 199 200 201 202 203 204 205 206 207 208 209 210 211 212 213 214 215 216 217 218 219 220 221 222 223 224 225 226 227 228 229 230 231 232 233 234 235 236 237 238 239 240 241 242 243 244 245 246 247 248 249 250 251 252 253 254 255 256 257 258 259 260 261 262 263 264 265 266 267 268 269 270 271 272 273 274 275 276 277 278 279 280 281 282 283 284 285 286 287 288 289 290 291 292 293 294 295 296 297 298 299 300 301 302 303 304 305 306 307 308 309 310 311 312 313 314 315 316 317 318 319 320 321 322 323 324 325 326 327 328 329 330 331 332 333 334 335 336 337 338 339 340 341 342 343 344 345 346 347 348 349 350 351 352 353 354 355 356 357 358 359 360 361 362 363 364 365 366 367 368 369 370 371 372 373 374 375 376 377 378 379 380 381 382 383 384 385 386 387 388 389 390 391 392 393 394 395 396 397 398 399 400 401 402 403 404 405 406 407 408 409 410 411 412 413 414 415 416 417 418 419 420 421 422 423 424 425 426 427 428 429 430 431 432 433 434 435 436 437 438 439 440 441 442 443 444 445 446 447 448 449 450 451 452 453 454 455 456 457 458 459 460 461 462 463 464 465 466 467 468 469 470 471 472 473 474 475 476 477 478 479 480 481 482 483 484 485 486 487 488 489 490 491 492 493 494 495 496 497 498 499 500 501 502 503 504 505 506 507 508 509 510 511 512 513 514 515 516 517 518 519 520 521 522 523 524 525 526 527 528 529 530 531 532 533 534 535 536 537 538 539 540 541 542 543 544 545 546 547 | //------------------------------------------------------------------------------ // Formula Name : MULTIPLE TREND LINE AFL for Amibroker by pipschart // Author : KrT group // Uploader : www.pipschart.com // E-mail : [email protected] // Amibroker Blog : www.pipschart.com/amibroker // Amibroker AFL : https://pipschart.com/latest-amibroker-afl-collection-download // Origin : Modified & Collected from different sources. //------------------------------------------------------------------------------ _SECTION_BEGIN("KrT group"); GfxSetBkMode(1); X=750; Y=1; Font=10; GfxSelectFont("Impact",Font*2.2, 550);GfxSetTextColor(colorRed);GfxTextOut("KrT group",x,y+10); GfxSelectFont("Impact",Font*2.2, 550);GfxSetTextColor(colorGreen);GfxTextOut("RESEARCH",x+120,Y+10); _SECTION_END(); //------------------------------------------------------------------------------ function IIR2( input, f0, f1, f2 ) { result[ 0 ] = input[ 0 ]; result[ 1 ] = input[ 1 ]; for( i = 2; i < BarCount; i++ ) { result[ i ] = f0 * input[ i ] + f1 * result[ i - 1 ] + f2 * result[ i - 2 ]; } return result; } Plot( Close, "Price", colorBlack, styleCandle ); Plot( IIR2( Close, 0.2, 1.4, -0.6 ), "function example", colorRed ); _SECTION_BEGIN("Bollinger Bands"); P = ParamField("Price field",-1); Periods = Param("Periods", 15, 2, 100, 1 ); Width = Param("Width", 2, 0, 10, 0.05 ); Color = ParamColor("Color", colorPaleBlue ); Style = ParamStyle("Style"); Plot( BBandTop( P, Periods, Width ), "BBTop" + _PARAM_VALUES(), Color, Style ); Plot( BBandBot( P, Periods, Width ), "BBBot" + _PARAM_VALUES(), Color, Style ); _SECTION_END(); //------------------------------------------------------------------------------ // Formula Name: Pivot Point with S/R Trendlines //------------------------------------------------------------------------------ // // On charts less then an hour -e.g. 5 min chart, will plot the daily Pivot // point and the hourly pivot point as a Line. In, addition, there are 3 // adjustable support and resistance trendlines drawn using highs and the lows // , % change is adjustable in the parameters. // //------------------------------------------------------------------------------ per1=Param("#1 S/R %", .25,.05,5,.05); LB1=Param("#1 Lookback Period",2,2,30,1); per2=Param("#2 S/R %", .5 ,.05,5,.05); LB2=Param("#2 Lookback Period",2,2,30,1); per3=Param("#3 S/R %", 2,.05,5,.05); LB3=Param("#3 Lookback Period",2,2,30,1); color=ParamColor("S/R Color",colorCustom11); colorPP=ParamColor("PP Color",colorCustom12); //////////////////////////////////////////////////////////////////////// ////Pivot and Support Resistance Lines ///////////////////////////// ////Plots a daily and hourly Pivot Point on 1min, 5min, etc... charts // //////// Also, 3 adjustable S/R lines/////////////////////////////////// //////////////////////////////////////// /////////////////////////////PIVOT POINT//////////////////////////////// TimeFrameSet(inDaily); AVGd = Ref((L + H + C),-1)/3; " PPd:\t "+ AVGd; TimeFrameRestore(); Plot( TimeFrameExpand(AVGd,inDaily,expandFirst),"",colorPP,styleStaircase); TimeFrameSet(inHourly); AVGh = Ref((L + H + C),-1)/3; " PPh:\t "+ Avgh; TimeFrameRestore(); Plot( TimeFrameExpand(AVGh,inHourly,expandFirst),"",colorPP,styleStaircase); //////////////////////////S?R LINES 1///////////////////////////////////// procedure SRlines(per,Lb) { ys0=LastValue(Trough(L,per,Lb)); ys1=LastValue(Trough(L,per,Lb-1)); xs0=BarCount - 1 - LastValue(TroughBars(L,per,Lb)); xs1=BarCount - 1 - LastValue(TroughBars(L,per,Lb-1)); yr0=LastValue(Peak(H,per,Lb)); yr1=LastValue(Peak(H,per,Lb-1)); xr0=BarCount - 1 - LastValue(PeakBars(H,per,Lb)); xr1=BarCount - 1 - LastValue(PeakBars(H,per,Lb-1)); sl = LineArray( xs0, ys0, xs1, ys1,1 ); rL = LineArray( xr0, yr0, xr1, yr1,1 ); Plot( sl, "S line", color,1 ); Plot( rl, "R line", color,1 ); } //////////////////////////S?R LINES 2///////////////////////////////////// SRlines(per1,Lb1); SRlines(per2,Lb2); SRlines(per3,Lb3); farback=Param("How Far back to go",100,50,5000,10); nBars = Param("Number of bars", 12, 5, 40); // -- Title. Title = Name() + " (" + StrLeft(FullName(), 15) + ") O: " + Open + ", H: " + High + ", L: " + Low + ", C: " + Close; // -- Plot basic candle chart PlotOHLC(Open, High, Low, Close, "BIdx = " + BarIndex() + "\n" + "O = " + O + "\n"+"H = "+ H + "\n"+"L = " + L + "\n"+"C ", colorWhite, styleCandle); GraphXSpace=7; // -- Create 0-initialized arrays the size of barcount aHPivs = H - H; aLPivs = L - L; // -- More for future use, not necessary for basic plotting aHPivHighs = H - H; aLPivLows = L - L; aHPivIdxs = H - H; aLPivIdxs = L - L; nHPivs = 0; nLPivs = 0; lastHPIdx = 0; lastLPIdx = 0; lastHPH = 0; lastLPL = 0; curPivBarIdx = 0; // -- looking back from the current bar, how many bars // back were the hhv and llv values of the previous // n bars, etc.? aHHVBars = HHVBars(H, nBars); aLLVBars = LLVBars(L, nBars); aHHV = HHV(H, nBars); aLLV = LLV(L, nBars); // -- Would like to set this up so pivots are calculated back from // last visible bar to make it easy to "go back" and see the pivots // this code would find. However, the first instance of // _Trace output will show a value of 0 aVisBars = Status("barvisible"); nLastVisBar = LastValue(Highest(IIf(aVisBars, BarIndex(), 0))); _TRACE("Last visible bar: " + nLastVisBar); // -- Initialize value of curTrend curBar = (BarCount-1); curTrend = ""; if (aLLVBars[curBar] < aHHVBars[curBar]) { curTrend = "D"; } else { curTrend = "U"; } // -- Loop through bars. Search for // entirely array-based approach // in future version for (i=0; i<farback; i++) { curBar = (BarCount - 1) - i; // -- Have we identified a pivot? If trend is down... if (aLLVBars[curBar] < aHHVBars[curBar]) { // ... and had been up, this is a trend change if (curTrend == "U") { curTrend = "D"; // -- Capture pivot information curPivBarIdx = curBar - aLLVBars[curBar]; aLPivs[curPivBarIdx] = 1; aLPivLows[nLPivs] = L[curPivBarIdx]; aLPivIdxs[nLPivs] = curPivBarIdx; nLPivs++; } // -- or current trend is up } else { if (curTrend == "D") { curTrend = "U"; curPivBarIdx = curBar - aHHVBars[curBar]; aHPivs[curPivBarIdx] = 1; aHPivHighs[nHPivs] = H[curPivBarIdx]; aHPivIdxs[nHPivs] = curPivBarIdx; nHPivs++; } // -- If curTrend is up...else... } // -- loop through bars } // -- Basic attempt to add a pivot this logic may have missed // -- OK, now I want to look at last two pivots. If the most // recent low pivot is after the last high, I could // still have a high pivot that I didn't catch // -- Start at last bar curBar = (BarCount-1); candIdx = 0; candPrc = 0; lastLPIdx = aLPivIdxs[0]; lastLPL = aLPivLows[0]; lastHPIdx = aHPivIdxs[0]; lastHPH = aHPivHighs[0]; if (lastLPIdx > lastHPIdx) { // -- Bar and price info for candidate pivot candIdx = curBar - aHHVBars[curBar]; candPrc = aHHV[curBar]; if ( lastHPH < candPrc AND candIdx > lastLPIdx AND candIdx < curBar) { // -- OK, we'll add this as a pivot... aHPivs[candIdx] = 1; // ...and then rearrange elements in the // pivot information arrays for (j=0; j<nHPivs; j++) { aHPivHighs[nHPivs-j] = aHPivHighs[nHPivs- (j+1)]; aHPivIdxs[nHPivs-j] = aHPivIdxs[nHPivs-(j+1)]; } aHPivHighs[0] = candPrc ; aHPivIdxs[0] = candIdx; nHPivs++; } } else { // -- Bar and price info for candidate pivot candIdx = curBar - aLLVBars[curBar]; candPrc = aLLV[curBar]; if ( lastLPL > candPrc AND candIdx > lastHPIdx AND candIdx < curBar) { // -- OK, we'll add this as a pivot... aLPivs[candIdx] = 1; // ...and then rearrange elements in the // pivot information arrays for (j=0; j<nLPivs; j++) { aLPivLows[nLPivs-j] = aLPivLows[nLPivs-(j+1)]; aLPivIdxs[nLPivs-j] = aLPivIdxs[nLPivs-(j+1)]; } aLPivLows[0] = candPrc; aLPivIdxs[0] = candIdx; nLPivs++; } } // -- Dump inventory of high pivots for debugging /* for (k=0; k<nHPivs; k++) { _TRACE("High pivot no. " + k + " at barindex: " + aHPivIdxs[k] + ", " + WriteVal(ValueWhen(BarIndex()==aHPivIdxs[k], DateTime(), 1), formatDateTime) + ", " + aHPivHighs[k]); } */ // -- OK, let's plot the pivots using arrows PlotShapes( IIf(aHPivs==1, shapeDownArrow, shapeNone), colorRed, 0, High, Offset=-15); PlotShapes( IIf(aLPivs==1, shapeUpArrow , shapeNone), colorBrightGreen, 0, Low, Offset=-15); _SECTION_BEGIN("Fib Retracements"); fibs = ParamToggle("Plot Fibs","Off|On",1); pctH = Param ("Pivot Hi %", 0.325,0.001,2.0,0.002); HiLB = Param ("Hi LookBack",1,1,BarCount-1,1); pctL = Param ("Pivot Lo %", 0.325,0.001,2.0,0.002); LoLB = Param ("Lo LookBack",1,1,BarCount-1,1); Back = Param ("Extend Left = 2",1,1,500,1); Fwd = Param("Plot Forward", 0, 0, 500, 1); text = ParamToggle("Plot Text","Off|On",1); hts = Param ("Text Shift", -60,-50,50,0.10); style =ParamStyle("Line Style",styleLine,styleNoLabel); x = BarIndex(); pRp = PeakBars( H, pctH, 1) == 0; yRp0 = SelectedValue(ValueWhen( pRp, H, HiLB)); xRp0 = SelectedValue(ValueWhen( pRp, x, HiLB)); pSp = TroughBars( L, pctL, 1) == 0; ySp0 = SelectedValue(ValueWhen( pSp, L, LoLB)); xSp0 = SelectedValue(ValueWhen( pSp, x, LoLB)); Delta = yRp0 - ySp0; function fib(ret) { retval = (Delta * ret); Fibval = IIf(ret < 1.0 AND xSp0 < xRp0, yRp0 - retval, IIf(ret < 1.0 AND xSp0 > xRp0, ySp0 + retval,IIf(ret > 1.0 AND xSp0 < xRp0, yRp0 - retval, IIf(ret > 1.0 AND xSp0 > xRp0, ySp0 + retval, Null)))); return FibVal; } x0 = Min(xSp0,xRp0)-Back; x1 = (BarCount -1); ////////////////////////////////////////////////////////////////// r236 = fib(0.236); r236I = LastValue (r236,1); r382 = fib(0.382); r382I = LastValue (r382,1); r050 = fib(0.50); r050I = LastValue (r050,1); r618 = fib(0.618); r618I = LastValue (r618,1); r786 = fib(0.786); r786I = LastValue (r786,1); e127 = fib(1.27); e127I = LastValue (e127,1); e162 = fib(1.62); e162I = LastValue (e162,1); e200 = fib(2.00); e200I = LastValue (e200,1); e262 = fib(2.62); e262I = LastValue (e262,1); e424 = fib(4.24); e424I = LastValue (e424,1); ////////////////////////////////////////////////////////////////// p00 = IIf(xSp0 > xRp0,ySp0,yRp0); p00I = LastValue (p00,1); p100 = IIf(xSp0 < xRp0,ySp0,yRp0); p100I = LastValue (p100,1); color00 =IIf(xSp0 > xRp0,colorLime,colorRed); color100 =IIf(xSp0 < xRp0,colorLime,colorRed); ////////////////////////////////////////////////////////////////// numbars = LastValue(Cum(Status("barvisible"))); fraction= IIf(StrRight(Name(),3) == "", 3.2, 3.2); ////////////////////////////////////////////////////////////////// if(fibs==1) { Plot(LineArray(xRp0-Fwd,yRp0,x1,yRp0,Back),"PR",32,8|styleNoRescale,Null, Null,Fwd); Plot(LineArray(xSp0-Fwd,ySp0,x1,ySp0,Back),"PS",27,8|styleNoRescale,Null, Null,Fwd); Plot(LineArray(x0-Fwd,r236,x1,r236,Back),"",45,style|styleNoRescale,Null, Null,Fwd); Plot(LineArray(x0-Fwd,r382,x1,r382,Back),"",44,style|styleNoRescale,Null, Null,Fwd); Plot(LineArray(x0-Fwd,r050,x1,r050,Back),"",41,style|styleNoRescale,Null, Null,Fwd); Plot(LineArray(x0-Fwd,r618,x1,r618,Back),"",43,style|styleNoRescale,Null, Null,Fwd); Plot(LineArray(x0-Fwd,r786,x1,r786,Back),"",42,style|styleNoRescale,Null, Null,Fwd); Plot(LineArray(x0-Fwd,e127,x1,e127,Back),"e127",47,style|styleNoRescale,Null, Null,Fwd); Plot(LineArray(x0-Fwd,e162,x1,e162,Back),"e162",47,style|styleNoRescale,Null, Null,Fwd); Plot(LineArray(x0-Fwd,e200,x1,e200,Back),"p200",47,style|styleNoRescale,Null, Null,Fwd); Plot(LineArray(x0-Fwd,e262,x1,e262,Back),"p262",47,style|styleNoRescale,Null, Null,Fwd); Plot(LineArray(x0-Fwd,e424,x1,e424,Back),"p424",25,style|styleNoRescale,Null, Null,Fwd); } ////////////////////////////////////////////////////////////////// if(text==1) { PlotText(" 0% = " + WriteVal(p00,fraction), LastValue(BarIndex())-(numbars/hts), p00I + 0.05, color00); PlotText("23% = " + WriteVal(r236,fraction), LastValue(BarIndex())-(numbars/hts), r236I + 0.05, 45); PlotText("38% = " + WriteVal(r382,fraction), LastValue(BarIndex())-(numbars/hts), r382I + 0.05, 44); PlotText("50% = " + WriteVal(r050,fraction), LastValue(BarIndex())-(numbars/hts), r050I + 0.05, 41); PlotText("62% = " + WriteVal(r618,fraction), LastValue(BarIndex())-(numbars/hts), r618I + 0.05, 43); PlotText("78% = " + WriteVal(r786,fraction), LastValue(BarIndex())-(numbars/hts), r786I + 0.05, 42); PlotText("100% = " + WriteVal(p100,fraction), LastValue(BarIndex())-(numbars/hts),p100I + 0.05, color100); PlotText("127% = " + WriteVal(e127,fraction), LastValue(BarIndex())-(numbars/hts),e127I + 0.05, 47); PlotText("162% = " + WriteVal(e162,fraction), LastValue(BarIndex())-(numbars/hts),e162I + 0.05, 47); PlotText("200% = " + WriteVal(e200,fraction), LastValue(BarIndex())-(numbars/hts),e200I + 0.05, 47); PlotText("262% = " + WriteVal(e262,fraction), LastValue(BarIndex())-(numbars/hts),e262I + 0.05, 47); PlotText("424% = " + WriteVal(e424,fraction), LastValue(BarIndex())-(numbars/hts),e424I + 0.05, 25); } _SECTION_END(); ////////////////////////////////////////////////////////////////// if (tchoice=1 ) { _N(Title = EncodeColor(colorWhite)+StrFormat(" {{NAME}} - {{INTERVAL}} {{DATE}} Open: %g, High: %g, Low: %g, Close: %g {{VALUES}}",O, H, L, C, SelectedValue( ROC( C, 1 ) ) )); } ////////////////////////////////////////////////////////////////// if (tchoice==2 ) { Title = EncodeColor(colorWhite)+ Date() + " Tick = " + EncodeColor(5) + Interval()+ EncodeColor(colorWhite) + " Open = " + EncodeColor(colorWhite) + O + EncodeColor(colorWhite) + " High = " + EncodeColor(5) + H + EncodeColor(colorWhite) + " Low = " + EncodeColor(colorRed) + L + EncodeColor(colorWhite) + " Close = " + EncodeColor(colorWhite) + C + "\n" + EncodeColor( colorWhite) +"_______________"+"\n"+ EncodeColor( colorWhite) + "424% = " + EncodeColor(25)+ e424 + " " +"\n"+ EncodeColor( colorWhite) + "262% = " + EncodeColor(47)+ e262 + " " +"\n"+ EncodeColor( colorWhite) + "200% = " + EncodeColor(47)+ e200 + " " +"\n"+ EncodeColor( colorWhite) + "162% = " + EncodeColor(47)+ e162 + " " +"\n"+ EncodeColor( colorWhite) + "127% = " + EncodeColor(47)+ e127 + " " +"\n"+ EncodeColor( colorYellow) + " Res = " + EncodeColor(32)+ p100 + " " +"\n"+ EncodeColor( colorWhite) + " 78% = " + EncodeColor(42)+ r786 + " " +"\n"+ EncodeColor( colorWhite) + " 62% = " + EncodeColor(43)+ r618 + " " +"\n"+ EncodeColor( colorWhite) + " 50% = " + EncodeColor(41)+ r050 + " " +"\n"+ EncodeColor( colorWhite) + " 38% = " + EncodeColor(44)+ r382 + " " +"\n"+ EncodeColor( colorWhite) + " 23% = " + EncodeColor(45)+ r236+ " " +"\n"+ EncodeColor( colorYellow) + " Sup = " + EncodeColor(34)+ p00 + " " ; } GraphXSpace=5; _SECTION_BEGIN("Background"); SetChartOptions(0,chartShowArrows|chartShowDates); SetChartBkColor(ParamColor("Outer panel",colorBlack)); // color of outer border SetChartBkGradientFill( ParamColor("Inner panel upper",colorBlack),ParamColor("Inner panel lower",colorBlack)); tchoice=Param("Title Selection ",2,1,2,1); |
How to Use AFL for Amibroker
- Download Amibroker AFL File.
- Now copy the afl file and paste it to \Program Files\AmiBroker\Formulas\Custom. [For 32 bit]
- Have you 64 bit operating system? Than paste it to : \Program Files(x86)\AmiBroker\Formulas\Custom.
- Go to formula section of Amibroker and you will get the afl in Custom folder.
Watch Our Video Tutorial | How To Set Amibroker?
Abu Huraira narrated that the Prophet said: A time will come upon the people when one will not care how one gains one’s money, legally or illegally. (Bukhari)
It is reported by Jabir that the Prophet said: The flesh and body that is raised on unlawful sustenance shall not enter Paradise. Hell is more deserving to the flesh that grows on one’s body out of unlawful sustenance. (Ahmad).
Abu Said related that the Prophet said: The truthful and trustworthy businessman will be in the company of Prophets, saints and martyrs on the Day of Judgment. (Darimi, Tirmidhi)
Tags amibroker afl
0 thoughts on “Multiple Trend Line AFL: Awesome Amibroker Trading System AFL”