Supply and Demand in Currency Market-part 04
By the last post Supply and Demand in Currency Market-part 03 we know the formation of supply and demand in Market.Now we start the next part in below.Hope its help you to understand the best things.
How to trade supply and demand zones?
Conventional recommendation is that we wait for price to come back to the zone [preferably untested fresh zone] to take a trade.
- Enter when price deep in the zone with a small stop-loss.
- Wait for PA confirmation then enter with bigger stop-loss.
Chart 6
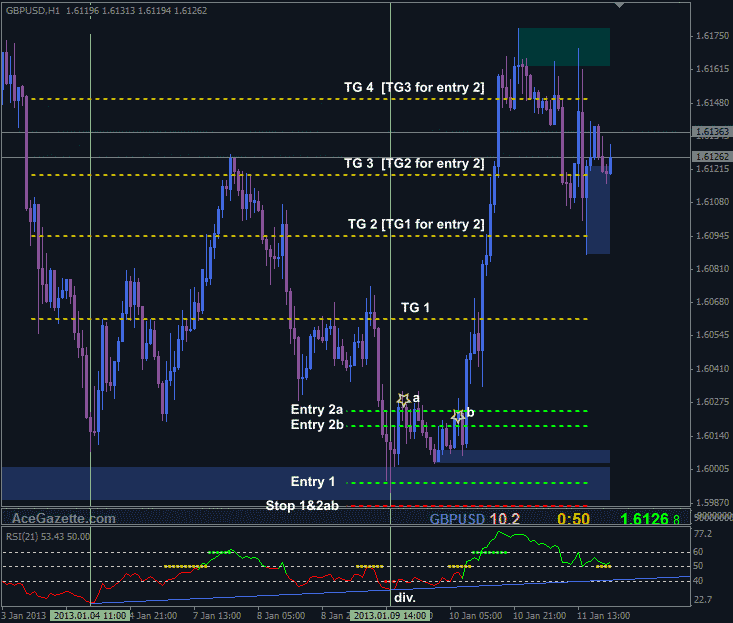
Obviously on hindsight entry 1 would have been the best one but on live charts at this point we don’t know if price is going to be contained in the zone or not. We could simply take the trade and hope for the best or look for something to indicate possibilities of price turning, zone holding. In my case first thing I see is signs of RSI divergence, and that would most likely be enough for me to take the trade [entry 1] as the risk is minimal, rather than delving into deep chart analysis.
On the other hand when we check left we don’t have clean clear arrival, zone has been tested before twice which means it’s not a fresh zone. Are there still decent buyers? Some negative vibes against taking trade. If we add a horizontal in the zone and check farther left we see some positive history.
Chart 7

If we opted for entry type 2, which says wait for PA confirmation once the price hits the zone, then we get two opportunities of entries on this occasion as highlighted on the chart 6 above. Notice, stop-loss size of entry 2a and 2b is bigger than entry 1.
In my trading, I use additional S&D zone entry in addition to above entries. I tend to take trades as or when a new zone established too. Sometimes before zone in sight. I will not go in details for this type of entries as it involves a few things to be taken into account such as reading left PA, spotting viable historical price lines and the way a new zone is created. This type of entries [some calls it “ahead of time trading”] requires a lot of experience and ability to keep in sync with overall market sentiment. Needless to say it’s more riskier than conventional entries.
How do we workout PA Config [Price action confirmation] in supply and demand zones? This is where chart and candlestick patterns come in. Remember, we use PA reading in and around the zones to try to determine if the zone will hold or not. I already have written few articles about PA patterns and their use in “Introduction to Price Action” AG forum category and under Education menu “Candle n Chart Patterns”. I need to add few more PA patterns yet but what is available so far is more than enough to make a good start. You don’t need to learn all PA patterns to be profitable trader. Important ones are more than enough in my opinion. I have started with important ones and most are done. I would recommend you to check them out so that you can fill the PA confirmation puzzle piece in place within the concept of S&D trading.
What time frames are best for supply and demand zones? Supply and demand zones are applicable to any timeframes, in other words supply and demand zones can be drawn and traded on any timeframes. Only thing to keep in mind, supply and demand zones in lower timeframes can be taken out more often and easily than higher time frames. Seasoned S&D traders tend to trade in the direction of higher time frame zones.
What does this mean?
For instance, we have price just tested H4 supply zone, zone is holding and price started to move away [down] the zone. In this situation if we are trading on say M5 we’d be looking to sell on decent supply zones of M5 rather than buying at demand zones. Is this means we shouldn’t enter any buy
orders in such circumstances? Of course not. You can always benefit from decent M5 demand zones too as price rarely moves in one straight line but using supply gives us additional probability in our favor. There are no need to be greedy. We cannot get all the pips. That’s until price comes close to possible reaction levels or closing on H4 demand zone. Regardless your trading chart time frame, it’s always wise to keep an eye on higher timeframes.
Why some zones doesn’t hold? If I knew the answer to this question, I’d say I have the ultimate crystal ball. I could trade with zero losses. Unfortunately, I don’t possess such crystal ball. All we can do is check the history, especially historical price lines to see possibilities for the zone may to be taken out or not. The only place to look for possible hints is left of your trading chart. Also keep in mind, during major events such as NFP, ECB press conference, FOMC minutes etc… most zones may be taken out easily.
0 thoughts on “Supply and Demand in Currency Market-part 04”