Candlestick Chart (The power of all chart) – part-02
Last part we learn about the history of the power of all chart. Hope it’s understood and realize how it comes to us. Today we learn how it is going on and why we told it is the power of all chart. We will learn step by step and more.
If you are a Forex trader you already know about candlestick. But when you decided to learn about candlestick format, you saw what a nice thing it is. But after someday passed, saw there is enough format and new & new name of candlestick which made us (including me also) fool. After than we chop down our breath and leave from this beautiful feature.
Ok let’s go to learn about this beautiful feature that is our hope and useful to us. We only learn those of beauty what actually useful for our real life.
NB : If you miss first part (Basic function of Candlesticks (The power of all chart) – part-01) please read first that and then enter this part.
Candlestick Patterns
Realize that a candlestick pattern is simply a means of reading data on the chart. Whether you trade stocks, Forex, options or futures it is a superior tool for technical analysis. Once you become familiar with the basic candlestick patterns you will quickly assimilate their meaning and easily interpret them.
The patterns are basically intuitive and the learning curve is small. There comes a point where you will recognize market sentiment without even identifying a specific candlestick pattern. No matter what system style or technique you may implement the fact is you will be that much more effective by making candlestick charts your tool of choice.
Candlestick charts are the most widely used for of charting for good reason. With a little practice and help, it is actually the most intuitive process for understanding current and future price action.
Basically we can divide four types of Candlestick patterns. They are
- Bullish Pattern
- Bearish Pattern
- Reversal Pattern
- Neutral Pattern.

By the bullish patterns its only focus uptrend situation. We consider this type of candle only when price goes to up.
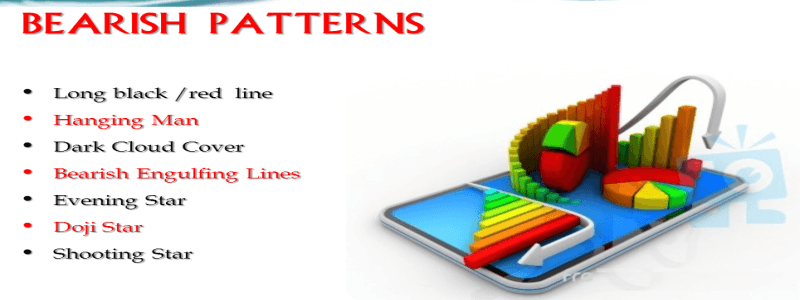 By the bearish patterns its only focus downtrend situation. We consider this type of candle only when price goes down.

By reversal patterns its only focus when change trend situation. This type of candle noke / alert me BE ALERT TREND WILL CHANGE soon.
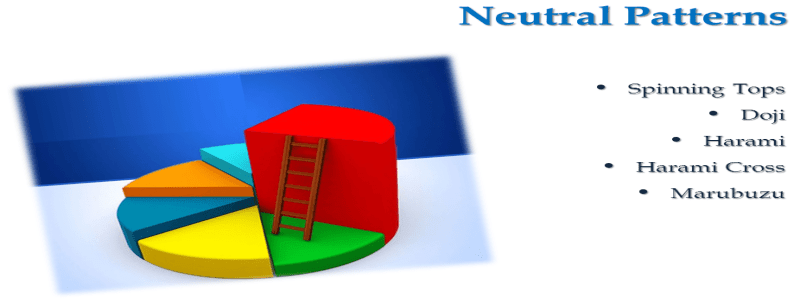
By this patterns its only focus when no change situation. This type of candle depends on next candle.If next candle bullish than it goes up and reversely if it is bearish then its go down.
Look Candle Chart together


How to use Candlestick Patterns part-03 upcoming…


0 thoughts on “Candlestick Chart (The power of all chart) – part-02”