Candlestick Pattern Recognition AFL Amibroker With Shading
Amibroker AFL
19,036 views
CANDLESTICK PATTERN RECOGNITION AFL
Candlestick Pattern Recognition afl amibroker actually inform you the trend indemnification. Many traders find it difficult to identify candlestick patterns properly. They always find out pattern explorer afl for amibroker. As well as find pattern explorer amibroker & pattern recognition afl. pattern explorer 4.5 crack, chart pattern recognition afl, pattern explorer crack, triangle pattern afl and so on also to be search. But don’t fine what he want.
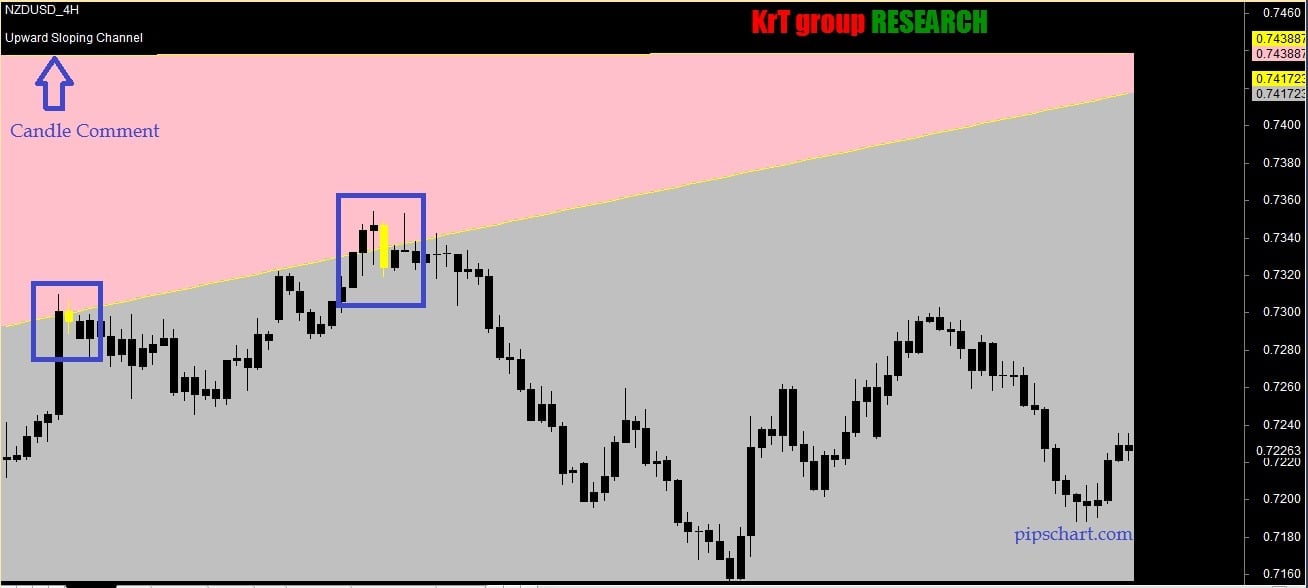
This Amibroker Afl is very useful for these traders. This AFL can identify candlestick patterns. By Using this afl hope meet your needs in Forex Trading.
Image of AFL [amibroker formula language].
Trader actually use this afl for the base of trailing stop formula.
HERE IS AMIBROKER AFL CODE
1 2 3 4 5 6 7 8 9 10 11 12 13 14 15 16 17 18 19 20 21 22 23 24 25 26 27 28 29 30 31 32 33 34 35 36 37 38 39 40 41 42 43 44 45 46 47 48 49 50 51 52 53 54 55 56 57 58 59 60 61 62 63 64 65 66 67 68 69 70 71 72 73 74 75 76 77 78 79 80 81 82 83 84 85 86 87 88 89 90 91 92 93 94 95 96 97 98 99 100 101 102 103 104 105 106 107 108 109 110 111 112 | //------------------------------------------------------------------ // Formula Name: Candlestick Pattern Recognition Afl With Shading // Author : KrT group // original pattern concept formula //By Dimitri //Modified by Anthony Faragasso // Uploader : www.pipschart.com // E-mail : [email protected] // Amibroker Blog : www.pipschart.com/amibroker // Origin : Modified & Collected from different sources. //------------------------------------------------------------------------------ _SECTION_BEGIN("The Fighter4 Logo"); GfxSetBkMode(1); X=750; Y=1; Font=10; GfxSelectFont("Impact",Font*2.2, 550);GfxSetTextColor(colorRed);GfxTextOut("KrT group",x,y); GfxSelectFont("Impact",Font*2.2, 550);GfxSetTextColor(colorGreen);GfxTextOut("RESEARCH",x+120,Y); _SECTION_END(); //------------------------------------------------------------------------------ _SECTION_BEGIN("Pattern_Recognition_with_Shading"); //Pattern Recognition graph with shading /*TRENDLINES BREAKOUT*/ x = Cum(1); per = Param("Percent",3,1,5,1); s1=L; s11=H; pS = TroughBars( s1, per, 1 ) == 0; endt= LastValue(ValueWhen( pS, x, 1 )); startt=LastValue(ValueWhen( pS, x, 2 )); endS = LastValue(ValueWhen( pS, s1, 1 ) ); startS = LastValue( ValueWhen( pS, s1, 2 )); dtS =endt-startt; aS = (endS-startS)/dtS; bS = endS; trendlineS = aS * ( x -endt ) + bS; pR = PeakBars( s11, per, 1 ) == 0; endt1= LastValue(ValueWhen( pR, x, 1 )); startt1=LastValue(ValueWhen( pR, x, 2 )); endR = LastValue(ValueWhen( pR, s11, 1 ) ); startR = LastValue( ValueWhen( pR, s11, 2 )); DTR=ENDT1-STARTT1; aR = (endR-startR)/dtR; bR = endR; trendlineR = aR * ( x -endt1 ) + bR; BEGIN=Min(STARTT,STARTT1); TRS = IIf(x>BEGIN-10,trendlineS,-1e10); TRR = IIf(x>BEGIN-10,trendlineR,-1e10); Condcolor=(Cross(C,trendlineR) AND X>ENDT1) OR (Cross(trendlineS,C) AND X>ENDT); BarColor=IIf(Condcolor,7,1); Plot(C,"Close",BarColor,styleCandle); Plot(TRS,"Support",colorYellow,styleLine); Plot(TRR,"Resist",colorYellow,styleLine); ///////////////////////////////////// // Shading // //////////////////////////////////// fill=Param("style",2,1,2,1); style=IIf(fill==1,styleHistogram,IIf(fill==2,styleArea,Null)); x=IIf(trs > trr,trr,trs); Plot(x,"",colorLightGrey,style); Plot(trr,"",colorPink,style); //////////////////////////////////////////// // Pattern Recognition in title bar // /////////////////////////////////////////// Lowline=Ends-starts; Highline=endr-startr; Wedge=IIf(Highline <0 AND Lowline > 0,1,0); DecendingTriangle=IIf(Highline < 0 AND Lowline==0,1,0); AscendingTriangle=IIf(Highline==0 AND Lowline > 0,1,0); DownChannel=IIf(Highline<0 AND Lowline<0,1,0); UpChannel=IIf(Highline>0 AND Lowline>0,1,0); BroadeningWedge=IIf(Highline > 0 AND Lowline < 0,1,0); /////////////////////////////////// // Bullish or Bearish breakout // ////////////////////////////////// BullishBreakout=Cross(C,trendlineR); BearishBreakout=Cross(trendlineS,C); Title=Name()+ WriteIf(wedge==1," Wedge","")+WriteIf(DecendingTriangle==1," Decending Triangle","")+WriteIf(AscendingTriangle==1,"Ascending Triangle","")/*+WriteVal(Lowline) */+WriteIf(DownChannel==1," Downward Sloping Channel","")+WriteIf(UpChannel==1," Upward Sloping Channel","")+WriteIf(broadeningWedge==1," Broadening Wedge","")+"\n"+EncodeColor(colorGreen)+WriteIf(bullishbreakout,"Bullish Breakout",EncodeColor(colorRed)+WriteIf(bearishbreakout,"Bearish Breakout",""))/* +WriteVal(highline)*/; ///////////////////////////////////// // Automatic Analysis // //////////////////////////////////// Filter=AscendingTriangle OR DecendingTriangle OR Wedge OR DownChannel OR UpChannel OR BroadeningWedge OR Bullishbreakout OR bearishbreakout; AddTextColumn(WriteIf(bullishbreakout,"bullish Breakout",""),"BullBreak"); AddTextColumn(WriteIf(bearishBreakout,"Bearish Breakout",""),"BearBreak"); AddTextColumn(WriteIf(ascendingtriangle,"Ascending Triangle",WriteIf (decendingtriangle,"Decending Triangle",WriteIf(Wedge,"Wedge",WriteIf (DownChannel,"Down Channel",WriteIf(UpChannel,"Up Channel",WriteIf (BroadeningWedge,"Broadening Wedge","")))))),"Pattern"); AddColumn(C,"Close"); _SECTION_END(); |
Download This Amibroker AFL
How to use Amibroker AFL
- Download the Amibroker AFL.
- Now copy the afl file and paste it to \Program Files\AmiBroker\Formulas\Custom. [For 32 bit]
- Have 64 bit operating system. Than paste it to \Program Files(x86)\AmiBroker\Formulas\Custom.
- Go to formula section of Amibroker and you will get the afl in Custom folder.
Don’t Know How To Set Amibroker? Than Just Click Here to Watch.
Tags amibroker afl


0 thoughts on “Candlestick Pattern Recognition AFL Amibroker With Shading”