Find the Bollinger Bands Chart in your Mind
Find the Bollinger Bands Chart in your Mind we come to end last part of it. For example, when the closing price of a security increases above its upper Bollinger Band, it will typically increase in that direction.
Bollinger Bands can also be used for identifying when trend reversals may occur. New highs or lows outside of the bands followed by another high/low inside of the bands typically indicates a reversal in the current trend. Since the standard deviation can be used as a volatility indicator, the current width of the envelope can also be used for trend information. A wide envelope indicates a high amount of volatility, while a narrow envelope indicates a lower amount. High volatility levels can sometimes be used to time trend reversals, such as market tops and bottoms. Low volatility levels can sometimes be used to time the beginning of new upward price trends following periods of consolidation.
Another observable trait of Bollinger Bands is that moves that begin at one band tend to go all the way to the other band. This can be useful for forecasting future values. Bollinger Bands are similar to Trading Bands and share many of their characteristics. However, unlike Bollinger Bands, Trading Bands do not vary in width based on volatility.
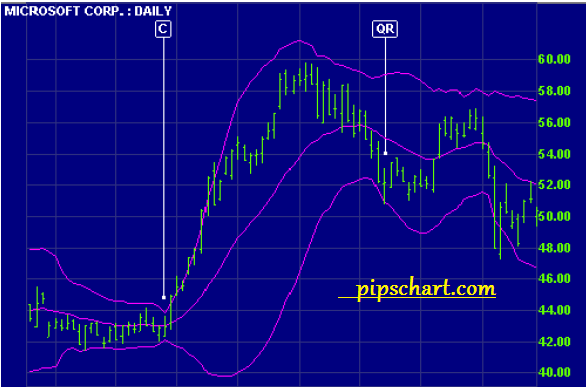
In this example Microsoft is charted using 20 day Bollinger bands at 2 standard deviations. Contracting bands warn that the market is about to trend: the bands first converge into a narrow neck, followed by a sharp price movement.
The first breakout is often a false move,preceding a strong trend in the opposite direction. A contracting range [C] is evident in June 1998: the bands converge to a width of $2, followed by a breakout in July to a new high.
A move that starts at one band normally carries through to the other, in a ranging market. A move outside the band indicates that the trend is strong and likely to continue – unless price quickly reverses. Note the quick reversal [QR] in early August. A trend that hugs one band signals that the trend is strong and likely to continue. Wait for divergence on a Momentum Indicator to signal the end of a trend.
In this example, 20 day Bollinger Bands at 2 standard deviations and 10 day Rate of Change.
1. Go short [S] – bearish divergence on ROC.
2. Contracting Bollinger Bands [C] warn of increased volatility. This begins with a false rally (note the ROC triple divergence) followed by a sharp fall.
3. Go long [L] – price hugs the lower band, followed by a bullish divergence on ROC.
4. Go short [S] – price hugs the upper band, followed by a bearish divergence on ROC.
So much boring isn’t it.Just take a rest and think about it. Than go to below link for know deeply.


0 thoughts on “Find the Bollinger Bands Chart in your Mind”